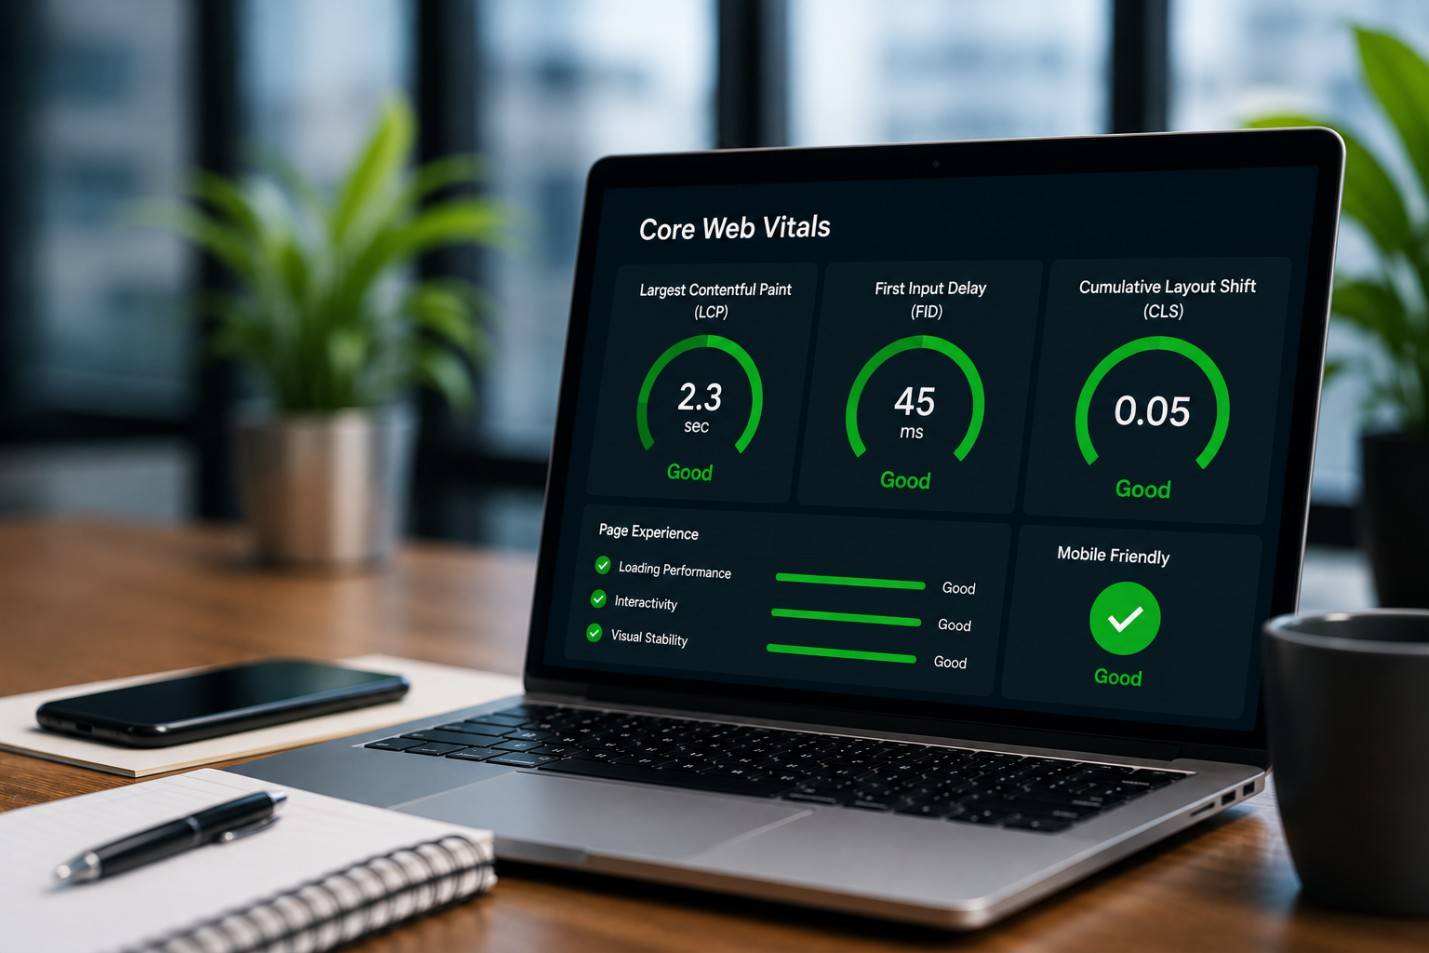
Google’s Core Web Vitals are no longer a technical afterthought. They are a direct ranking signal that shapes how your website performs in search results across the UAE. At Searchical SEO, we know that getting these scores right can mean the difference between a page that ranks and one that is simply overlooked. Here is how to do it properly.
Key Takeaways
- Core Web Vitals measure loading speed, interactivity, and visual stability.
- Poor scores hurt both Google rankings and user experience.
- PageSpeed Insights and Search Console are your primary measurement tools.
- Image optimization alone can resolve a significant portion of LCP issues.
- Consistent monitoring matters more than a one-off fix.
What Are Google’s Core Web Vitals?
Before we get into the steps, it helps to understand what you are actually measuring. Google’s Core Web Vitals are three specific page experience metrics that reflect how users actually feel when they use your website.
According to Google Search Central, the three metrics are:
- Largest Contentful Paint (LCP): This measures loading performance. Google considers anything under 2.5 seconds as good.
- Interaction to Next Paint (INP): This replaced First Input Delay (FID) in March 2024. It measures how quickly your page responds to user interaction. Under 200 milliseconds is the target.
- Cumulative Layout Shift (CLS): This measures visual stability. A score of 0.1 or below is considered good.
As published on web.dev, these three metrics form the core of Google’s page experience assessment, and meeting the recommended thresholds is strongly advised for competitive search performance.
Step 1: Measure Your Current Scores First
You cannot improve what you have not measured. Start by running your website through Google PageSpeed Insights. This free tool provides your LCP, INP, and CLS scores for both mobile and desktop, along with specific recommendations for each issue it identifies.
Also check your Core Web Vitals report inside Google Search Console. Unlike PageSpeed Insights, Search Console shows real user data collected over a 28-day period, giving you a true picture of how actual visitors experience your site.
- Run PageSpeed Insights across multiple key pages, not just your homepage.
- Note which pages are flagged as ‘Poor’ or ‘Needs Improvement’.
- Prioritize the pages that receive the most organic traffic.
Step 2: Optimize and Compress Your Images
Images are the most common culprit behind poor LCP scores. Large, uncompressed image files take longer to load, pushing your LCP time well beyond the 2.5-second threshold. This is particularly important for UAE businesses, where mobile browsing dominates.
According to a Khaleej Times report on UAE e-commerce growth, e-commerce in the UAE nearly quadrupled in value from 2019, reaching $8 billion in 2024. With this volume of mobile traffic, fast-loading pages are a competitive requirement, not a luxury.
- Convert images to next-generation formats such as WebP or AVIF.
- Use responsive images so mobile devices load appropriately sized files.
- Implement lazy loading for images that appear below the fold.
- Set explicit width and height attributes on every image to prevent layout shifts.
Step 3: Implement Lazy Loading for Off-Screen Content
Lazy loading delays the loading of images and content that are not immediately visible on screen. This reduces the initial page load time, which directly improves your LCP score by ensuring the browser prioritizes visible content first.
Add the loading=’lazy’ attribute to image elements that sit below the fold. For your hero image or above-the-fold content, avoid lazy loading entirely as this would delay the LCP element and worsen your score.
- Apply lazy loading to all non-critical images and iframes.
- Never apply lazy loading to the primary hero image or banner.
- Test the outcome in PageSpeed Insights after each change.
Step 4: Remove or Defer Render-Blocking Resources
JavaScript and CSS files that load before the page renders can significantly delay how quickly users see content. These are called render-blocking resources, and they are a common cause of poor LCP scores.
Load time and response time remain among the most critical indicators of web performance, with direct links to user engagement and search visibility.
- Move non-critical JavaScript to the bottom of the page or use the ‘defer’ attribute.
- Inline critical CSS and defer the rest.
- Use a content delivery network (CDN) to serve static assets faster.
Step 5: Improve Server Response Time
Your Time to First Byte (TTFB) measures how quickly your server responds to a request. A slow TTFB delays everything else on the page. For UAE-based businesses serving local customers, using a server or CDN with regional infrastructure makes a measurable difference.
As highlighted in an Arabian Business report on the UAE’s digital performance rankings, the UAE maintained the world’s number one ranking in the Speedtest Global Index from July 2024 to June 2025. While network infrastructure in the UAE is exceptional, your server itself must match that capability.
- Choose a hosting provider with servers located in or near the UAE.
- Implement server-side caching to reduce the time spent generating pages.
- Upgrade to faster hosting if your current plan cannot handle your traffic volume.
Step 6: Set Fixed Dimensions on All Media Elements
Cumulative Layout Shift (CLS) occurs when content moves unexpectedly while a page is loading. One of the most frequent causes is images and videos that do not have defined width and height attributes, causing the browser to reflow the layout once the media loads.
- Add width and height attributes to every image and video element in your HTML.
- Reserve space for ad slots and embedded content using CSS aspect-ratio.
- Avoid inserting content above existing content after the page has started loading.
- Test your CLS score after design updates, as even minor changes can cause shifts.
A low CLS score builds user trust. When content does not unexpectedly jump or shift, users feel more in control of the experience, which directly reduces bounce rates.
Step 7: Reduce JavaScript Execution Time
Heavy JavaScript is the primary cause of poor INP scores. When a user clicks a button or submits a form and the page takes too long to respond, that delay is measured by INP. Long JavaScript tasks block the main thread and prevent the browser from responding to user input.
An INP under 200 milliseconds is considered good, while anything above 500 milliseconds is classified as poor and will negatively affect your page experience score.
- Break large JavaScript tasks into smaller, non-blocking chunks.
- Remove unused JavaScript libraries and plugins.
- Consider code splitting to load only the scripts needed for each page.
- Use the Chrome DevTools Performance panel to identify and address long tasks.
Step 8: Optimize Web Fonts
Custom fonts are a frequently overlooked source of performance issues. When a browser downloads a font file before rendering text, it can cause a flash of invisible text (FOIT) or a flash of unstyled text (FOUT), both of which contribute to layout instability and perceived slowness.
- Use font-display: swap in your CSS to show fallback text while the custom font loads.
- Preload your primary font files using a <link rel=’preload’> tag in the page head.
- Limit the number of font weights and styles you load to what is strictly necessary.
- Host fonts locally rather than loading them from third-party servers where possible.
Optimizing your fonts is a small change with a visible impact. Users see content immediately, and your CLS and LCP scores both benefit from removing the loading delay.
Step 9: Enable Browser Caching and Compression
Browser caching tells a visitor’s browser to save static files locally after the first visit. On subsequent visits, those files load from the device rather than downloading again, dramatically reducing load time for returning users.
The UAE’s e-commerce market reached AED 32.3 billion in 2024, with consumer expectations for seamless digital experiences continuing to grow. Businesses that serve returning customers quickly will see lower bounce rates and stronger engagement metrics.
- Set cache-control headers to define how long browsers should cache specific assets.
- Enable GZIP or Brotli compression on your server to reduce file sizes in transit.
- Minify CSS, JavaScript, and HTML files to remove unnecessary characters and whitespace.
Step 10: Monitor Your Scores Regularly and Keep Improving
Core Web Vitals optimization is not a one-time task. Google measures performance data from real users over a 28-day rolling window. This means changes you make today will take time to fully reflect in your scores. Regular monitoring keeps you ahead of issues before they affect your rankings.
Website performance and digital presence work together as part of a broader search strategy. Fixing Core Web Vitals is one component of a complete SEO approach.
Understanding why local SEO is crucial for business growth in the UAE helps frame Core Web Vitals in context. A locally relevant, well-ranked page that also loads fast is the most competitive combination available to UAE businesses.
- Schedule a monthly review of your Core Web Vitals in Google Search Console.
- Re-run PageSpeed Insights after every major website update or redesign.
- Track how score improvements correlate with changes in organic traffic and bounce rate.
- Use real user monitoring (RUM) tools for continuous data collection beyond Google’s tools.
For businesses seeking dedicated support with technical performance, web design services include performance optimization as part of every build, ensuring your site meets Google’s Core Web Vitals thresholds from the foundation up.
A strong correlation between Web Vitals scores and user engagement, conversion rates, and search engine rankings. Treating Core Web Vitals as a technical SEO priority is well-supported by academic evidence.
Conclusion
Google’s Core Web Vitals will only grow in importance as search becomes more competitive across the UAE. The businesses that invest in performance now will hold a compounding advantage over those that do not. If you want expert support with technical SEO and website performance, get in touch with us. We are ready to help your website perform at its best.
FAQs:
What are Google Core Web Vitals?
Core Web Vitals are three Google metrics measuring loading speed (LCP), interactivity (INP), and visual stability (CLS) of a page.
Do Core Web Vitals affect Google rankings?
Yes. Google uses Core Web Vitals as ranking signals, rewarding pages that deliver fast, stable, and responsive user experiences.
What is a good LCP score for Core Web Vitals?
A good LCP score is 2.5 seconds or less. Anything above 4.0 seconds is considered poor by Google’s standards.
How do I check my website’s Core Web Vitals score?
Use Google PageSpeed Insights, Google Search Console, or Chrome DevTools to measure your Core Web Vitals performance.
What causes poor Cumulative Layout Shift (CLS)?
CLS is caused by images without dimensions, late-loading ads, and dynamically injected content that pushes the page layout unexpectedly.
How long does it take to improve Core Web Vitals?
Technical fixes can show improvement within days. Full gains reflect in Google’s data after 28 days of real user measurement.
